
A look back at the latest outing.
This is a follow on post from Part 1. And is similar to the 2018 breakdown. Hence I will be brief and stick just to the results.
Tuning Data
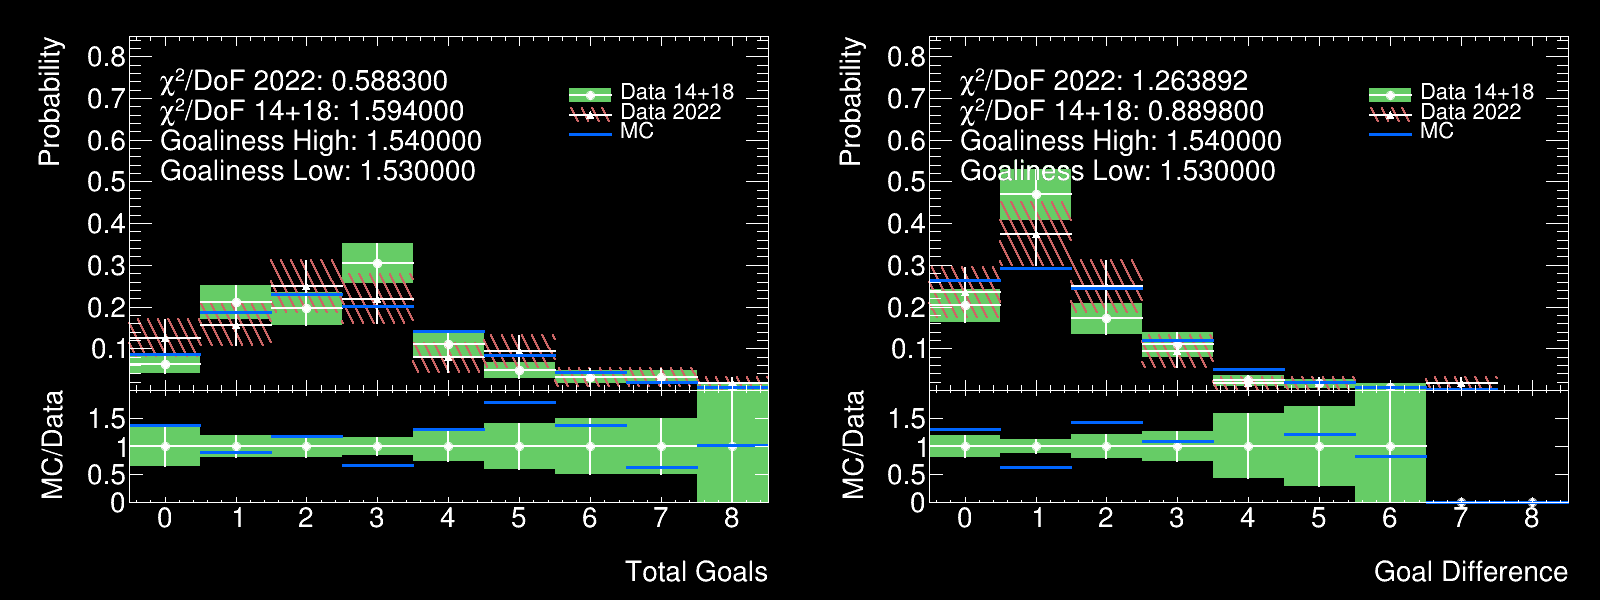
Would a winter tournament affect the number of goals scored or the goal difference? What about the stricter injury time rules? It seems not, at least not visible with the statistics of a single tournament. The distributions from 2022 are statistically compatible with the combined data of 2014 & 2018.
Note that here we are looking at the outcome of all 64 games, for knockout games the score is taken at the end of regular time.
Individual Game Results
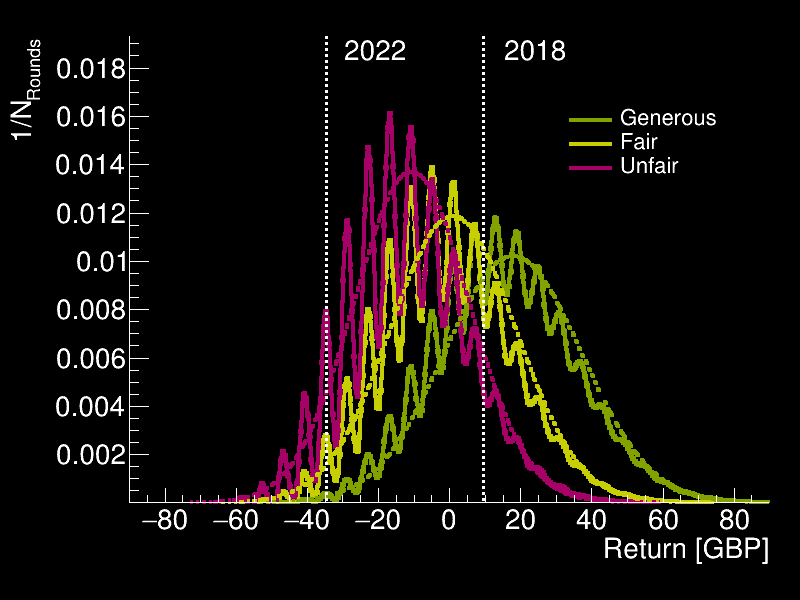
Here things didn’t go so great on this outing. The odds are taken again from the Betfair sports-book in the days running up to each game, and a spread of possible returns is computed as a Gaussian assuming that the odds are an exact representation of reality, as well as with a +20% and -20% bias. It is the -20% bias in red which we’re most interested in as we expect the bookmaker to have built in an edge (another way to estimate the bias: the sports-book odds were on average 16% worse than the betting exchange odds).
In 2018 the result of the per-game WCMC predictions was +£9.50, which was a \(1.06\sigma\) trial based on the “unfair” distribution obtained back then. For 2022 and again sticking with the “unfair” distribution, we have a mean (expected loss) of -£10.60 and a realised loss of -£29.50. This trial is still only at \(1.48\sigma\), and so once again we don’t really learn anything.
We’re going to need a lot more data (tournaments!) if we want to start to be able to make any inferences here!
Progression Predictions
So we can’t say much about the individual games, what about the progression? Starting towards the end of the tournament, after the Round of 16 the teams going into the Quarter Finals were Croatia, Brazil, Morocco, Portugal, Netherlands, Argentina, England, France. The actual winning combination was AR/FR/HR_MA (with Brazil, England, Netherlands and Portugal knocked out) - this is one of the 128 possible permutations (reminder: the ordering of 2nd and 3rd place is not accounted for here, they’re listed alphabetically).
WCMC predicted BR/FR/AR_PT as most likely at 4.1%, with the actual result was predicted as the 44th most likely, at 0.83%.
Stepping back to just after the group stage, here we have 16 teams. If we focus again on just looking at the top-four then there are 2,048 permutations. The WCMC predicted BR/ES/AR_FR at 1.17%, and the actual result was the 290th prediction at 0.09%.
If we try and compute the full output from after the group stage then we’re up to 32,768 possible results. We had the modal predict BR/ES/AR_FR/EN_HR_NL_PT as the modal outcome at 0.25% probability, with the actual outcome AR/FR/HR_MA/BR_EN_NL_PT in 1,089th place at 0.02% of all outcomes.
We can also look towards the end of the list, in joint last place at 0.000002% probability and requiring 50 million pseudo-tournaments for it to happen even once we have the exciting result AU/EN/JP_MA/CH_KR_PL_US. But what a result it would have been to have England and Australia in the final!
Can we take the next step to the full tournament? In a word - no. We already saw that running 1 million pseudo-tournament generated a unique outcome almost every time. When we were looking at the 128 possible permutations above from after the Round of 16, this was due to there being 7 (meaningful, we don’t include the 3rd place run off) games and hence \(2^7\) possible outcomes. When we add in the eight games from the Round of 16 we then have \(2^{15}\) which is how we got 32,768 potential outcomes.
This formulae breaks down somewhat at the group sages, as there are multiple ways for pairs of teams to advance. But as an upper ceiling there are (somewhere less than) \(2^{63} = 9,223,372,036,854,775,808\) outcomes. Hence we shouldn’t be surprised that we ran 1,000,000 simulations and got back 999,598 distinct results.
Source Code
WCMC the World Cup Monte Carlo is written in C++ and uses the ROOT library for plotting.